
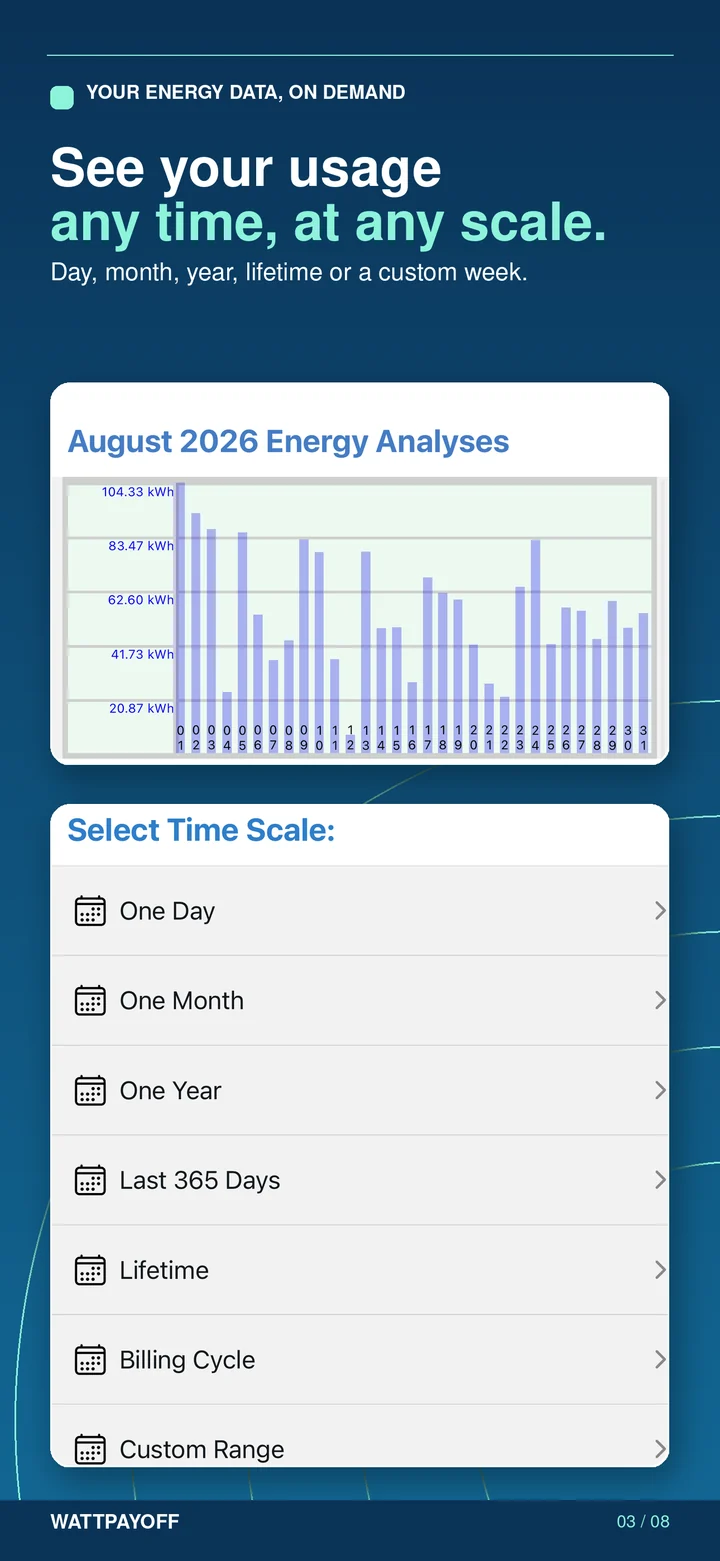
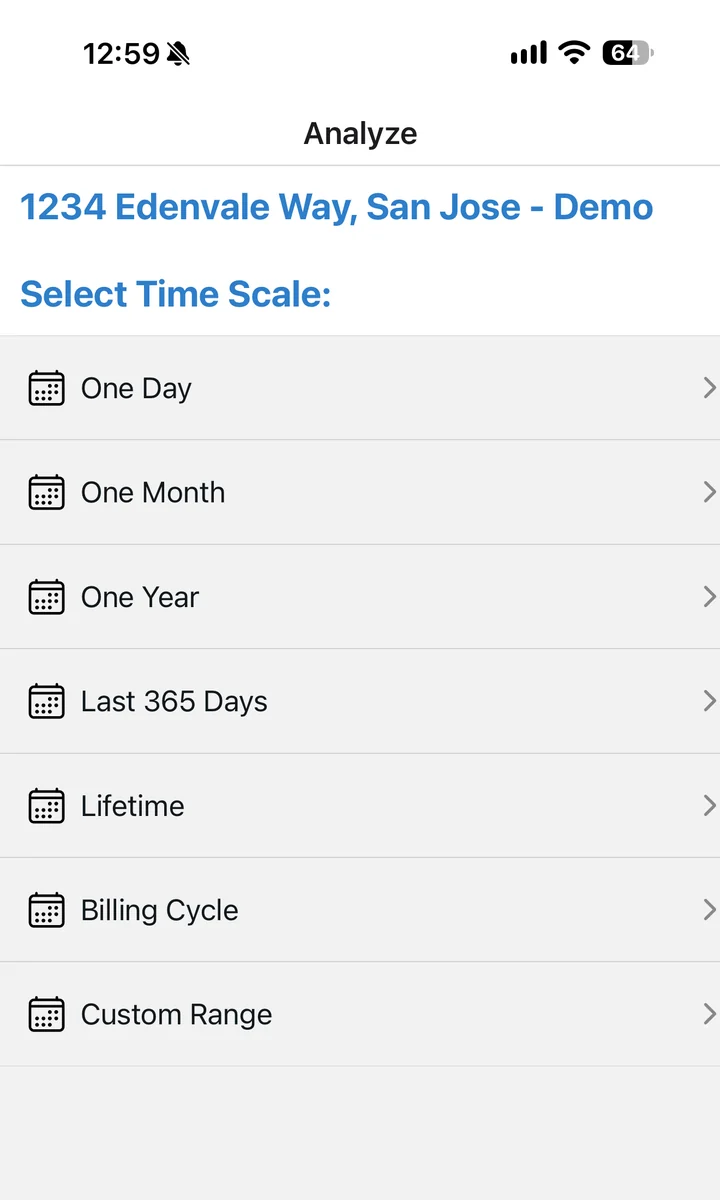
WattPayoff charts your PG&E smart-meter usage at the scale you choose: one day, one month, one year, the last 365 days, your lifetime with the app, a single billing cycle, or a custom date range. Each chart shows the total kilowatt-hours for the period and the pattern behind it.
Can I see usage by the week?
Yes, with a custom range: pick any start and end date, such as one week. There is no one-week preset.
Why does the pattern matter for my rate plan?
Time-of-use plans price electricity by the hour, so two homes using the same total can pay different amounts. Seeing when your usage happens, for instance a 4 to 9 pm peak from cooking and air conditioning, explains why one plan beats another for you.
Frequently asked questions about usage charts
How current is the data?
Usually one to two days behind. PG&E supplies your usage to the app daily, and it is usually one or two days behind the current time.
Can I export the charts?
Yes. The analyses, including the usage charts, can be exported to email through the app's Export To Email option.