
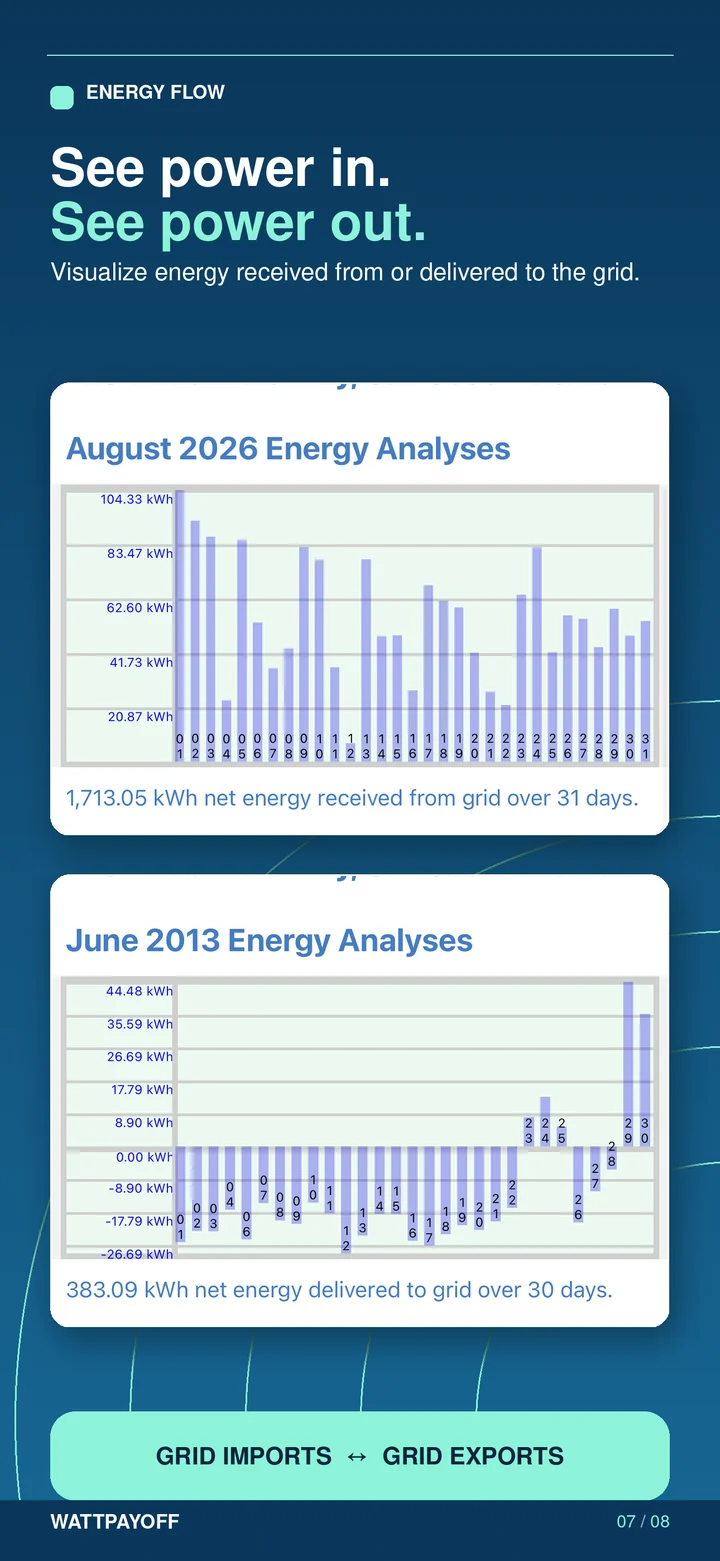
WattPayoff charts the net energy your home received from the PG&E grid and the net energy it delivered back, from your PG&E meter data, by day, month, year, billing cycle or custom range. Positive bars are energy taken from the grid; negative bars are energy sent to it.
Why does energy sent to the grid matter for my rate plan?
Because exports and imports are priced by the hour. On time-of-use plans, electricity you take from the grid at 4 to 9 pm costs most, and under PG&E's Solar Billing Plan exported energy is credited at values that vary by time of day and season.
Seeing when you import and export explains your bill and your true-up, the settlement at the end of each 12-month billing cycle that starts when PG&E approves your system to operate.
Frequently asked questions about solar in the app
Does the app work with NEM 2 (Net Energy Metering 2) and the Solar Billing Plan (also called NEM 3)?
WattPayoff supports NEM 2. Support for the Solar Billing Plan (NEM 3) is in development, so the app does not yet model Solar Billing Plan costs or savings. Solar Billing Plan customers must stay on E-ELEC, so the other plans the app shows are not available to them.
Does it show my solar panels' total production?
No. WattPayoff shows what your PG&E meter records: net energy to and from the grid. Total production is in your inverter's or installer's app.